3. UNIT 2. Statistical Learning#
This Unit includes main introduction to statistical learning, strongly based in [1].
UNIT 2. Statistical Learning
Evaluation of the loss function in K-means
Polynomial regression
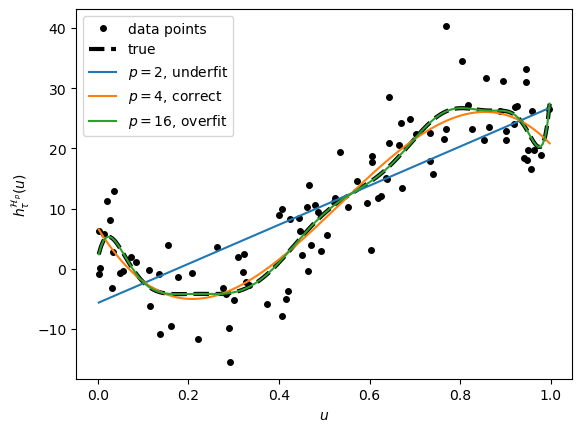
Training data with fitted curves fordifferent \(p\)
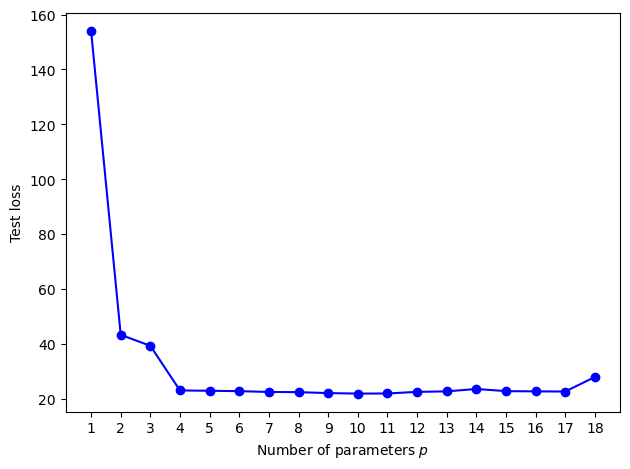
Test loss as function of the number of parameters \(p\) of the model.
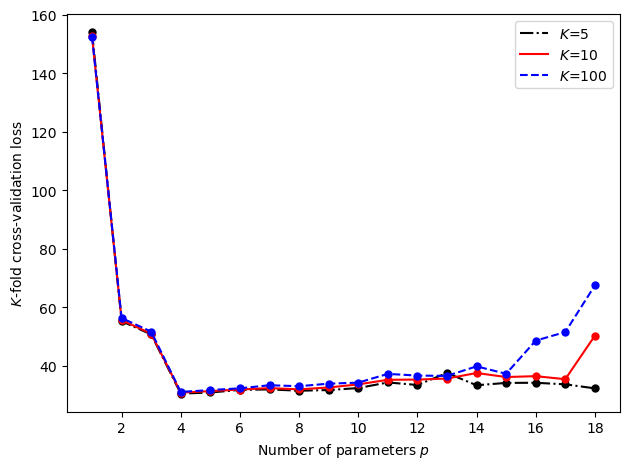
Cross-validation
3.1. Evaluation of the loss function in K-means#
K-means is an example of unsupervised learning method. We will use this method along with scipy in order to evaluate the loss function calculated for a given dataset.
We will first import some data using numpy.
import numpy as np
Xmat = np.genfromtxt('datasets/clusterdata.csv', delimiter=',')
n, D = Xmat.shape
n,D
(300, 2)
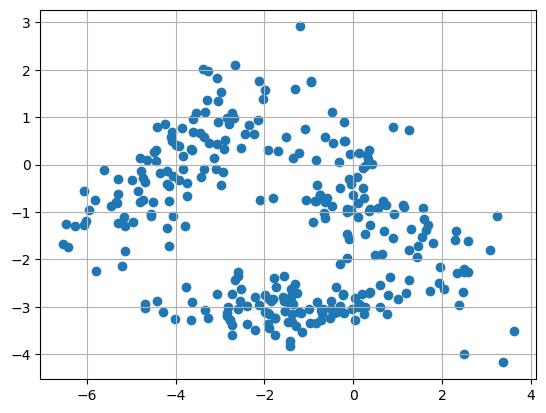
The first thing to do is always a visualization of the data
import matplotlib.pyplot as plt

fig, ax = plt.subplots()
ax.scatter(Xmat[:,0],Xmat[:,1])
ax.grid(True)
plt.savefig("../figures/data.png")
plt.show()
First, we will run a K-means using scikit-learn, a high level wrapper for machine learning with python
from sklearn.cluster import KMeans

kmeans = KMeans(n_clusters=3,random_state=0,n_init="auto").fit(Xmat)
kmeans.labels_
array([1, 1, 1, 1, 1, 1, 1, 1, 1, 1, 1, 1, 1, 1, 1, 1, 1, 1, 1, 1, 1, 1,
       1, 1, 1, 1, 1, 1, 1, 1, 1, 1, 1, 1, 1, 1, 1, 1, 1, 1, 1, 1, 1, 1,
       1, 1, 1, 1, 1, 1, 1, 1, 1, 1, 1, 1, 1, 1, 1, 1, 1, 1, 1, 1, 1, 1,
       1, 1, 1, 1, 1, 1, 1, 1, 1, 1, 1, 1, 1, 1, 1, 1, 1, 1, 1, 1, 1, 1,
       1, 1, 1, 1, 1, 1, 1, 1, 1, 1, 1, 1, 0, 0, 0, 0, 0, 0, 0, 0, 0, 0,
       0, 0, 0, 0, 0, 0, 0, 0, 0, 0, 0, 0, 0, 0, 0, 0, 0, 0, 1, 0, 1, 0,
       0, 2, 0, 0, 0, 0, 0, 1, 0, 0, 0, 0, 1, 0, 1, 1, 1, 0, 0, 0, 0, 0,
       0, 0, 0, 0, 0, 0, 0, 0, 0, 0, 0, 0, 0, 0, 0, 0, 0, 0, 0, 0, 0, 0,
       0, 0, 0, 0, 0, 0, 0, 0, 0, 0, 0, 0, 0, 0, 0, 0, 0, 0, 0, 0, 0, 0,
       0, 0, 2, 2, 0, 2, 2, 2, 2, 2, 2, 2, 2, 2, 2, 2, 2, 2, 2, 0, 2, 0,
       2, 2, 2, 2, 2, 0, 2, 0, 2, 2, 2, 2, 2, 2, 2, 2, 0, 2, 2, 2, 2, 2,
       0, 2, 2, 2, 2, 2, 2, 0, 2, 2, 2, 2, 2, 2, 2, 2, 2, 0, 2, 2, 2, 2,
       2, 0, 2, 2, 2, 2, 2, 0, 2, 2, 2, 2, 2, 2, 2, 2, 0, 0, 2, 0, 0, 2,
       2, 2, 2, 2, 2, 2, 2, 2, 0, 2, 2, 2, 2, 2], dtype=int32)
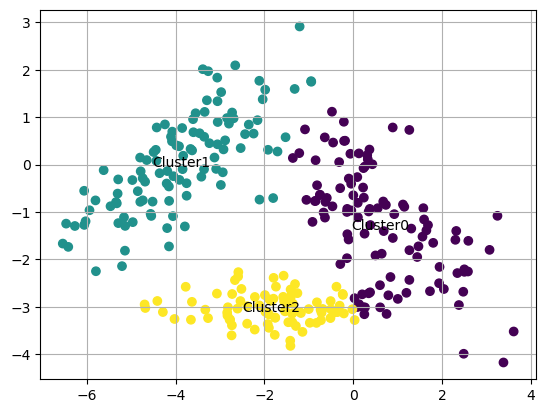
centers=kmeans.cluster_centers_
centers
array([[ 0.6177812 , -1.29975072],
       [-3.86806187,  0.04564101],
       [-1.84791126, -3.02916471]])
Now we plot again the clusters with colors for each label
labels=kmeans.labels_

cluster_name = ["Cluster"+str(i) for i in set(labels)]

fig, ax = plt.subplots()
ax.scatter(Xmat[:,0],Xmat[:,1],c=labels)
for i, txt in enumerate(cluster_name): # hello
    ax.text(centers[i,0],centers[i,1],s=txt,ha="center",va="center")
ax.grid(True)
plt.show()
with seaborn we can also find a nice plot in a faster way
import seaborn as sns
sns.scatterplot(x=Xmat[:,0],y=Xmat[:,1],hue=labels,legend='full',palette="Set1")
---------------------------------------------------------------------------
ModuleNotFoundError                       Traceback (most recent call last)
Cell In[6], line 1
----> 1 import seaborn as sns
      2 sns.scatterplot(x=Xmat[:,0],y=Xmat[:,1],hue=labels,legend='full',palette="Set1")

ModuleNotFoundError: No module named 'seaborn'
We will now run it in a more manual and detailed way, without the use of scikit-learn We start by initializing the centers.
K = 3
c  = np.array([[-2.0,-4,0],[-3,1,-1]])  #initialize centers
cold = np.zeros(c.shape)
dist2 = np.zeros((K,n))
#for h in range(0,100):
while np.abs(c - cold).sum() > 0.001:
     print(c)
     cold = c.copy()
     for i in range(0,K): #compute the squared distances
          dist2[i,:] = np.sum((Xmat - c[:,i].T)**2, 1)

     label = np.argmin(dist2,0) #assign the points to nearest centroid
     minvals = np.amin(dist2,0)
     for i in range(0,K): # recompute the centroids
          c[:,i] = np.mean(Xmat[np.where(label == i),:], 1).reshape(1,2)

print('Loss = {:3.3f}'.format(minvals.mean()))
print(minvals)
[[-2. -4.  0.]
 [-3.  1. -1.]]
[[-1.97122735 -3.99500505  0.48593068]
 [-3.01536786  0.0589819  -1.24373331]]
[[-1.92700937 -3.94414519  0.56115053]
 [-3.01308366  0.02001296 -1.29804366]]
[[-1.9285638  -3.92373524  0.56115053]
 [-3.04155556  0.01309036 -1.29804366]]
Loss = 2.288
[1.10370659e+00 3.16794127e+00 9.26321472e-01 6.36198076e+00
 8.19130169e-02 7.65221873e-01 1.90343757e+00 3.87433330e-01
 3.42126461e+00 3.95242456e-02 1.28746860e+00 2.61470537e+00
 6.60069131e-01 9.83476613e-01 5.00950821e+00 9.27041473e+00
 9.08533546e-02 6.56955782e-01 8.42663900e-01 5.42274818e+00
 3.28259714e-01 1.39524393e+00 9.30193801e+00 4.87563968e-01
 1.39388416e-01 2.88914157e+00 1.68884217e-01 2.76846935e-01
 3.60211197e-01 1.99402612e+00 6.37654752e-01 5.54788080e-01
 7.14620966e-01 3.98814235e+00 2.64597189e+00 4.12086589e+00
 4.06560394e+00 6.19786157e+00 1.95279352e-01 5.87981054e+00
 7.81544253e-01 1.89578819e-02 1.58114767e+01 1.59106964e+00
 1.24970759e+00 1.54724188e+00 5.80169437e-01 2.79809498e+00
 2.58827718e+00 1.56788245e-01 6.29450307e+00 7.55126173e-01
 2.11125454e+00 3.16687274e+00 3.17499809e+00 2.29500150e+00
 7.19450650e-01 1.70127421e-01 2.04775355e+00 1.18756618e+00
 5.94045269e+00 2.65376419e+00 1.33189853e+00 2.61497243e+00
 2.50971365e+00 1.15383239e+01 1.23152835e+00 2.27242889e-01
 1.51577676e+00 2.44436812e+00 2.52548096e-01 1.00716864e+00
 1.54302396e+00 4.87459232e+00 4.82658821e+00 3.33043111e-01
 2.20382717e+00 6.63840451e-01 3.62129345e-01 1.75664599e+00
 9.94602417e-01 2.62081394e-01 6.52313073e-01 1.08904875e+00
 3.20499488e+00 1.16366830e+01 8.61817141e+00 2.46213616e-01
 4.80191816e-01 1.97584570e+00 7.95787481e-01 9.66485293e+00
 6.23044138e+00 1.21366725e+00 5.31963203e-01 7.20398700e+00
 8.03798887e+00 3.08059107e+00 1.13250857e-01 4.26708629e+00
 1.26435074e+00 3.91000069e+00 3.34324056e+00 5.62382386e-01
 1.60412838e+00 1.39746630e-01 2.91118234e+00 5.60292242e+00
 2.30189623e+00 3.81623770e+00 6.09244632e+00 1.66161109e-01
 1.58651762e+00 5.20660068e-01 1.28762722e+00 3.96034709e+00
 5.44074737e+00 2.82918501e-01 4.94435099e+00 1.18292865e-01
 2.03787792e+00 1.16602956e+00 2.65935575e+00 7.76241771e-01
 5.08711032e-01 6.55672696e+00 1.62636781e+01 4.49737124e-01
 6.08708861e+00 2.15050345e+00 3.86225757e+00 2.25852470e+00
 7.57486935e-01 2.64345611e+00 3.47281604e-01 1.73673166e-01
 2.56056275e+00 1.09820137e+01 6.87173401e+00 3.24082157e+00
 7.27456514e+00 4.61362079e+00 2.53893181e+00 1.44035262e+00
 4.29147431e+00 5.21623035e-01 4.11675258e+00 4.99996659e+00
 5.02390888e+00 4.13191182e+00 7.32940303e-01 1.23456152e+00
 2.30590112e-01 2.40346630e-01 1.71944739e+00 1.42420158e-01
 3.87376424e-01 2.64658243e+00 9.49783995e-01 5.79860454e-01
 1.42771516e+01 5.15342382e-01 3.11544396e+00 4.71103811e+00
 1.68527721e+00 1.01124027e+00 2.71735334e+00 5.01697014e+00
 1.20401047e+00 1.22828133e+00 3.79904667e+00 3.10943027e+00
 4.60659922e+00 2.18761033e+00 1.46187638e+00 5.74747581e+00
 4.62576799e-01 5.51874621e+00 2.13933425e+00 1.19274129e+00
 1.36760292e+00 4.43987948e+00 2.72913321e-02 1.18239043e+00
 2.59255662e+00 1.67005336e+00 6.15207790e-01 4.22885589e+00
 1.09236120e+00 2.62886596e+00 1.96367462e-01 1.66335775e+00
 1.05018702e+00 2.30007270e+00 4.71160544e-01 6.90490130e+00
 3.06360029e-02 4.17291823e+00 1.78829118e+00 1.66644606e+00
 3.32877806e-01 1.83417521e+00 2.39280214e+00 3.54104248e-02
 9.71440745e-01 8.57466028e-02 3.01524403e-01 2.51650185e+00
 9.00230729e-01 2.04091281e+00 1.43003044e+00 1.05355761e-01
 8.33502890e-01 6.75307367e-03 9.96668028e-01 1.54330680e+00
 6.42110498e-02 3.03354967e+00 5.18414108e-01 2.94461794e+00
 8.83137151e-01 6.18140374e+00 3.97633793e-02 8.59633916e-01
 7.29692942e-01 2.90559003e+00 3.93359104e-02 2.59904337e+00
 3.97286989e-01 3.02875510e+00 2.21762720e+00 1.48792678e+00
 1.02653170e+00 1.30353944e+00 2.96678597e+00 2.08537385e-01
 2.20328300e+00 7.82104486e-01 1.60013270e-02 3.90905913e+00
 6.53113989e-01 5.61312184e-01 3.13260955e+00 2.47656289e+00
 2.52067057e-01 3.60714597e+00 1.59703074e-01 9.01337381e-01
 3.91650593e-01 1.36566149e+00 7.61761529e-01 8.63626265e-01
 3.41509664e+00 1.64479911e-01 4.42063882e-01 4.43310734e+00
 3.11082936e-01 1.39950091e+00 7.18360934e-01 3.25502334e+00
 7.57171073e+00 1.64074023e-01 2.58883476e-01 5.22163437e-01
 3.37382868e-01 3.55945840e+00 2.68774527e+00 7.96441535e-01
 2.04766652e+00 4.56350731e-01 2.04906580e+00 3.47565354e+00
 3.18512410e-01 1.42210012e-01 7.66775883e+00 3.30355289e-01
 3.95448763e-01 2.91801964e+00 1.56676421e-01 7.66083351e-01
 3.04779263e+00 2.05917343e+00 2.73682145e+00 2.18834246e+00
 1.98642053e+00 1.25553813e+00 5.73958598e-01 4.34455361e-01
 8.30947169e-01 9.72857253e-03 1.96138433e+00 6.22493856e-02
 5.42555071e-01 5.55735339e+00 1.55951686e+00 1.87152470e-01
 6.70689369e-02 2.77515675e-01 1.50853483e+00 6.17071685e-01]
3.2. Polynomial regression#
Let us generate data drawn from iid random points that have a normal distribution with expectation \(10 − 140ui + 400u^2i − 250u^3\) and variance 25. This is an example of a polynomial regression model. Using a squared-error loss, the optimal prediction function \(h^*(u) = E[Y | U = u]\) is thus
import numpy as np
from numpy.random import rand , randn

import matplotlib.pyplot as plt

def generate_data(beta , sig, n):  # generate data with the requested variance given by sig**2
   u = np.random.rand(n, 1)
   y = (u ** np.arange(0, 4)) @ beta + sig * np.random.randn(n, 1) # we use @ for matrix multiplication
   return u, y

np.random.seed(12)
beta = np.array([[10, -140, 400, -250]]).T
n = 100
sig = 5
u, y = generate_data(beta , sig, n)

# define the smooth line
xx = np.arange(np.min(u), np.max(u)+5e-3, 5e-3)
yy = np.polyval(np.flip(beta), xx)     # evaluate the polynomial

plt.plot(u, y, '.', markersize=8)
plt.plot(xx, yy, '--',linewidth=3)

# %%%%%%%%%%%%%%%%%%%%%%%%%%%%%%%%%%%%%%%%%
plt.xlabel(r'$u$')
plt.ylabel(r'$h^*(u)$')
plt.legend(['data points','true'])
plt.savefig('../figures/polydatpy.pdf',format='pdf')
plt.show()
# %%%%%%%%%%%%%%%%%%%%%%%%%%%%%%%%%%%%%%%%%
---------------------------------------------------------------------------
ImportError                               Traceback (most recent call last)
File ~/miniconda3/lib/python3.11/site-packages/numpy/core/__init__.py:23
     22 try:
---> 23     from . import multiarray
     24 except ImportError as exc:

File ~/miniconda3/lib/python3.11/site-packages/numpy/core/multiarray.py:10
      9 import functools
---> 10 from . import overrides
     11 from . import _multiarray_umath

File ~/miniconda3/lib/python3.11/site-packages/numpy/core/overrides.py:6
      4 import os
----> 6 from numpy.core._multiarray_umath import (
      7     add_docstring, implement_array_function, _get_implementing_args)
      8 from numpy.compat._inspect import getargspec

ImportError: libopenblas.so.0: cannot open shared object file: No such file or directory

During handling of the above exception, another exception occurred:

ImportError                               Traceback (most recent call last)
/home/jordivilla/GitHub/Classes/Data-Science-with-Python/code/UNIT2-Statistical-Learning.ipynb Cell 16 line 1
----> <a href='vscode-notebook-cell:/home/jordivilla/GitHub/Classes/Data-Science-with-Python/code/UNIT2-Statistical-Learning.ipynb#X21sZmlsZQ%3D%3D?line=0'>1</a> import numpy as np
      <a href='vscode-notebook-cell:/home/jordivilla/GitHub/Classes/Data-Science-with-Python/code/UNIT2-Statistical-Learning.ipynb#X21sZmlsZQ%3D%3D?line=1'>2</a> from numpy.random import rand , randn
      <a href='vscode-notebook-cell:/home/jordivilla/GitHub/Classes/Data-Science-with-Python/code/UNIT2-Statistical-Learning.ipynb#X21sZmlsZQ%3D%3D?line=3'>4</a> import matplotlib.pyplot as plt

File ~/miniconda3/lib/python3.11/site-packages/numpy/__init__.py:141
    138 # Allow distributors to run custom init code
    139 from . import _distributor_init
--> 141 from . import core
    142 from .core import *
    143 from . import compat

File ~/miniconda3/lib/python3.11/site-packages/numpy/core/__init__.py:49
     25     import sys
     26     msg = """
     27
     28 IMPORTANT: PLEASE READ THIS FOR ADVICE ON HOW TO SOLVE THIS ISSUE!
   (...)
     47 """ % (sys.version_info[0], sys.version_info[1], sys.executable,
     48         __version__, exc)
---> 49     raise ImportError(msg)
     50 finally:
     51     for envkey in env_added:

ImportError:

IMPORTANT: PLEASE READ THIS FOR ADVICE ON HOW TO SOLVE THIS ISSUE!

Importing the numpy C-extensions failed. This error can happen for
many reasons, often due to issues with your setup or how NumPy was
installed.

We have compiled some common reasons and troubleshooting tips at:

    https://numpy.org/devdocs/user/troubleshooting-importerror.html

Please note and check the following:

  * The Python version is: Python3.11 from "/home/jordivilla/miniconda3/bin/python"
  * The NumPy version is: "1.24.3"

and make sure that they are the versions you expect.
Please carefully study the documentation linked above for further help.

Original error was: libopenblas.so.0: cannot open shared object file: No such file or directory
3.2.1. Training data with fitted curves fordifferent \(p\)#
We will check the models for \(p = 2, 4, 16\). The true cubic polynomial curve for p = 4 is also plotted (dashed line).
from numpy.linalg import norm , solve

max_p = 18
p_range = np.arange(1, max_p + 1, 1)
X = np.ones((n, 1))
betahat, trainloss = {}, {}

for p in p_range:  # p is the number of parameters
    if p > 1:
        X = np.hstack((X, u**(p-1)))  # add column to matrix

    betahat[p] = solve(X.T @ X, X.T @ y)
    trainloss[p] = (norm(y - X @ betahat[p])**2/n)

p = [2, 4, 16]  # select three curves

#replot the points and true line and store in the list "plots"
plots = [plt.plot(u, y, 'k.', markersize=8)[0],
         plt.plot(xx, yy, 'k--',linewidth=3)[0]]
# add the three curves
for i in p:
    yy = np.polyval(np.flip(betahat[i]), xx)
    plots.append(plt.plot(xx, yy)[0])

# %%%%%%%%%%%%%%%%%%%%%%%%%%%%%%%%%%%%%%%%%
plt.xlabel(r'$u$')
plt.ylabel(r'$h^{\mathcal{H}_p}_{\tau}(u)$')
plt.legend(plots,('data points', 'true','$p=2$, underfit',
                  '$p=4$, correct','$p=16$, overfit','d'))
plt.savefig('../figures/polyfitpy.pdf',format='pdf')
plt.show()
# %%%%%%%%%%%%%%%%%%%%%%%%%%%%%%%%%%%%%%%%%
/tmp/ipykernel_63313/2927019202.py:12: RuntimeWarning: invalid value encountered in matmul
  betahat[p] = solve(X.T @ X, X.T @ y)
3.2.2. Test loss as function of the number of parameters \(p\) of the model.#
# generate test data
u_test, y_test = generate_data(beta, sig, n)

MSE = []
X_test = np.ones((n, 1))

for p in p_range:
    if p > 1:
        X_test = np.hstack((X_test, u_test**(p-1)))

    y_hat = X_test @ betahat[p]  # predictions
    MSE.append(np.sum((y_test - y_hat)**2/n))   # calculate the mean square error

# %%%%%%%%%%%%%%%%%%%%%%%%%%%%%%%%%%%%%%%%%
plt.plot(p_range, MSE, 'b', p_range, MSE, 'bo')
plt.xticks(ticks=p_range)
plt.xlabel('Number of parameters $p$')
plt.ylabel('Test loss')
plt.tight_layout()
plt.savefig('../figures/MSEpy.pdf',format='pdf')
plt.show()
# %%%%%%%%%%%%%%%%%%%%%%%%%%%%%%%%%%%%%%%%%
3.2.3. Cross-validation#
For the polynomial regression example, we can calculate a \(K\)-fold cross-validation loss with a nonrandom partitioning of the training set using the following code.
K_vals = [5, 10, 100]  # number of folds
cv = np.zeros((len(K_vals), max_p))
X = np.ones((n, 1))

for p in p_range:
    if p > 1:
        X = np.hstack((X, u**(p-1)))
    j = 0
    for K in K_vals:
        loss = []
        for k in range(1, K+1):
            # integer indices of test samples
            test_ind = ((n/K)*(k-1) + np.arange(1, n/K + 1) - 1).astype('int')
            train_ind = np.setdiff1d(np.arange(n), test_ind)

            X_train, y_train = X[train_ind, :], y[train_ind, :]
            X_test, y_test = X[test_ind, :], y[test_ind]

            # fit model and evaluate test loss
            betahat = solve(X_train.T @ X_train, X_train.T @ y_train)
            loss.append(norm(y_test - X_test @ betahat) ** 2)

        cv[j, p-1] = sum(loss) / n
        j += 1

# %%%%%%%%%%%%%%%%%%%%%%%%%%%%%%%%%%%%%%%%%
p1 = plt.plot(p_range, cv[0, :], 'k-.', p_range, cv[0, :], 'k.', markersize=10)[0]
p2 = plt.plot(p_range, cv[1, :], 'r', p_range, cv[1, :], 'r.', markersize=10)[0]
p3 = plt.plot(p_range, cv[2, :], 'b--', p_range, cv[2, :], 'b.', markersize=10)[0]
plt.xticks(range(2, 19, 2))
plt.xlabel('Number of parameters $p$')
plt.ylabel('$K$-fold cross-validation loss')
plt.legend((p1,p2,p3),('$K$=5','$K$=10','$K$=100'))
plt.tight_layout()
plt.savefig('../figures/crossvalpy.pdf',format='pdf')
plt.show()
# %%%%%%%%%%%%%%%%%%%%%%%%%%%%%%%%%%%%%%%%%
/tmp/ipykernel_63313/2728808787.py:20: RuntimeWarning: invalid value encountered in matmul
  betahat = solve(X_train.T @ X_train, X_train.T @ y_train)
Dirk P. Kroese, Zdravko Botev, Thomas Taimre, and Radislav: Vaisman. Data Science and Machine Learning: Mathematical and Statistical Methods. Machine Learning & Pattern Recognition. Chapman & Hall/CRC, 2020. URL: https://acems.org.au/data-science-machine-learning-book-available-download (visited on 2023-08-15).
